Configure the User Account Audit
Step-by-step guide to configuring the User Account Audit check in octoja.
Written By Erdinc Akay
Last updated About 1 month ago
Configure the User Account Audit
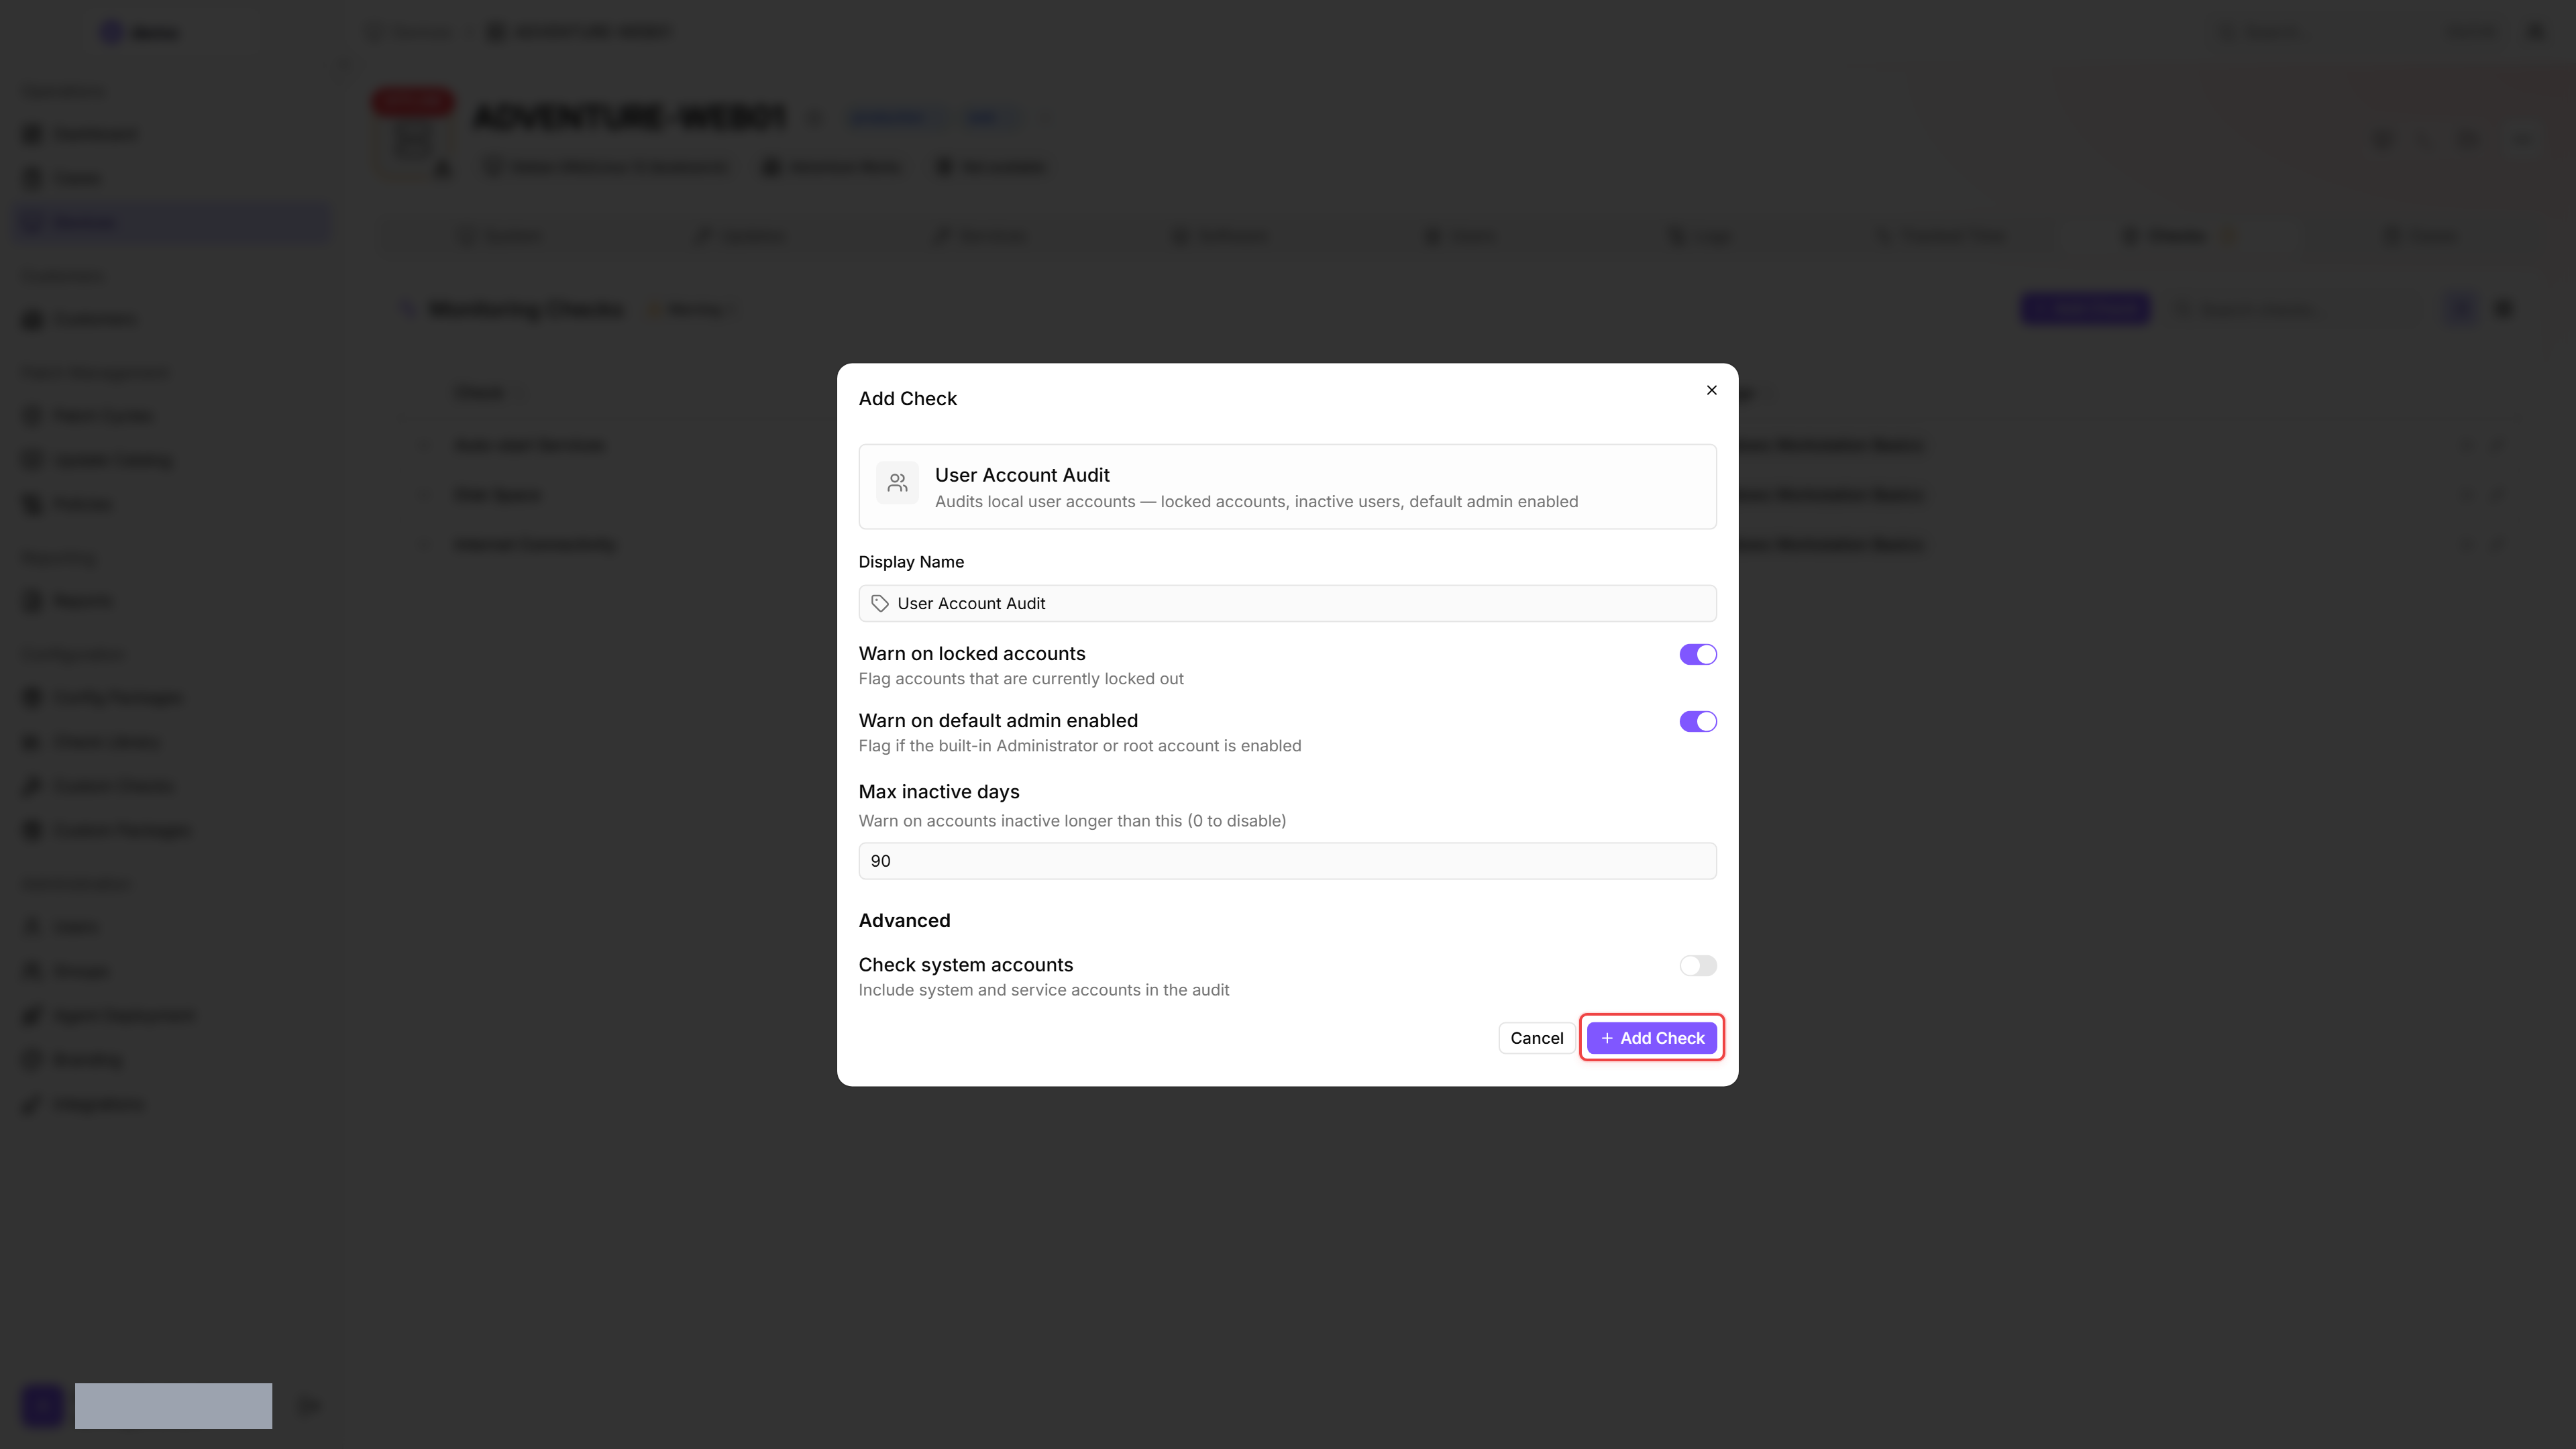
The User Account Audit check inspects local user accounts on a device — locked accounts, inactive users, and the default administrator account. It helps you detect security hygiene issues such as dormant accounts that should be removed.
Prerequisites
- You need the Monitoring Check Management permission.
- The target device must have a connected agent.
Steps
- Go to Devices and open the device.
- Click the Checks tab → Add Check → User Account Audit.
- Configure the audit rules:
- Click Add Check.
Tips
- Locked accounts may indicate brute-force attempts — investigate why the account was locked.
- The default admin warning detects servers where the built-in Administrator account is still enabled. Best practice is to disable it and use a named admin account.
- Set Max inactive days based on your organisation's policy. 90 days is a common compliance requirement.
- Leave Check system accounts disabled unless you need to audit service accounts specifically. System accounts such as
SYSTEMandLocalServiceare never interactive and will produce false alarms.
After the first check interval, the result appears in the device's Checks tab.
Read the audit results
Open the check in the Checks tab to see two views. Detail shows the latest run as a point-in-time snapshot: the account totals (total, enabled, admins, locked, inactive) and the flagged accounts highlighted with the reason each was flagged. History shows how the audit has changed over previous runs.
Follow the trend over time
The History view charts the total account count across previous runs as a trend line. A rising line means accounts were added on the device; a falling line means accounts were removed. The line gives you a quick read on whether the account population is growing, shrinking, or holding steady — it is a trend, not an explicit added/removed count, so read it together with the per-run table below.
Below the chart, a per-run table lists every recorded run with these columns:
Comparing the rows lets you see when an account first appeared or was flagged, so you can tie a change in the trend line to a specific run.
See also: User Account Audit Reference