Monitor Device Performance Live

The octoja device detail page shows live telemetry for any connected device, updated every two seconds without a page refresh.

Written By Erdinc Akay

Last updated 26 days ago

The octoja device detail page shows live telemetry for any connected device, updated every two seconds without a page refresh.

Prerequisites

  • The device must be online (agent connected).
  • Any logged-in user can view live telemetry — no additional permissions are required.

Open the device detail page

From the Devices list, click the device you want to inspect. The detail page opens with the System tab active by default.

Tabs on the device detail page

The page is organized into tabs across the top. While the device is online, the live tabs update automatically without a refresh.

TabWhat it shows
SystemCPU usage (%), total and used memory, disk capacity and free space, and network receive/transmit rates. A GPU card appears when the device reports GPUs. Click Open chart history on a card to expand its recent history
VulnerabilitiesLywand vulnerability findings for the device. Only appears when the device has a Lywand score
UpdatesPending OS updates reported by the agent; shows an up-to-date confirmation when none are pending
ServicesAll services with display name, start type, and current status
SoftwareInstalled applications and versions reported by the agent
Tracked TimeTime entries logged against this device
ProcessesRunning processes with PID, name, CPU time, and memory. The tab title carries a badge with the live process count. This tab only appears when the device reports live processes, when you have an active process search, or when the section reports an error — an idle device with no running processes may not show this tab at all
LogsActivity log for this device — remote actions, deployments, patch management, tasks, and sessions
Inventory HistoryA timeline of inventory changes — installed and removed software, services, pending updates, local users, network adapters, and before/after hardware and system details. Choose the last 7, 30, or 90 days, or the last year
ChecksChecks assigned to the device and their latest results
AutomationsAutomation workflows relevant to this device — the assigned automations and their recent run history. Only appears when your role has the Manage automations permission
CasesSupport cases linked to this device. Only appears when your role can view cases (the View Cases permission)

The live telemetry updates in real time as the device reports its current state:
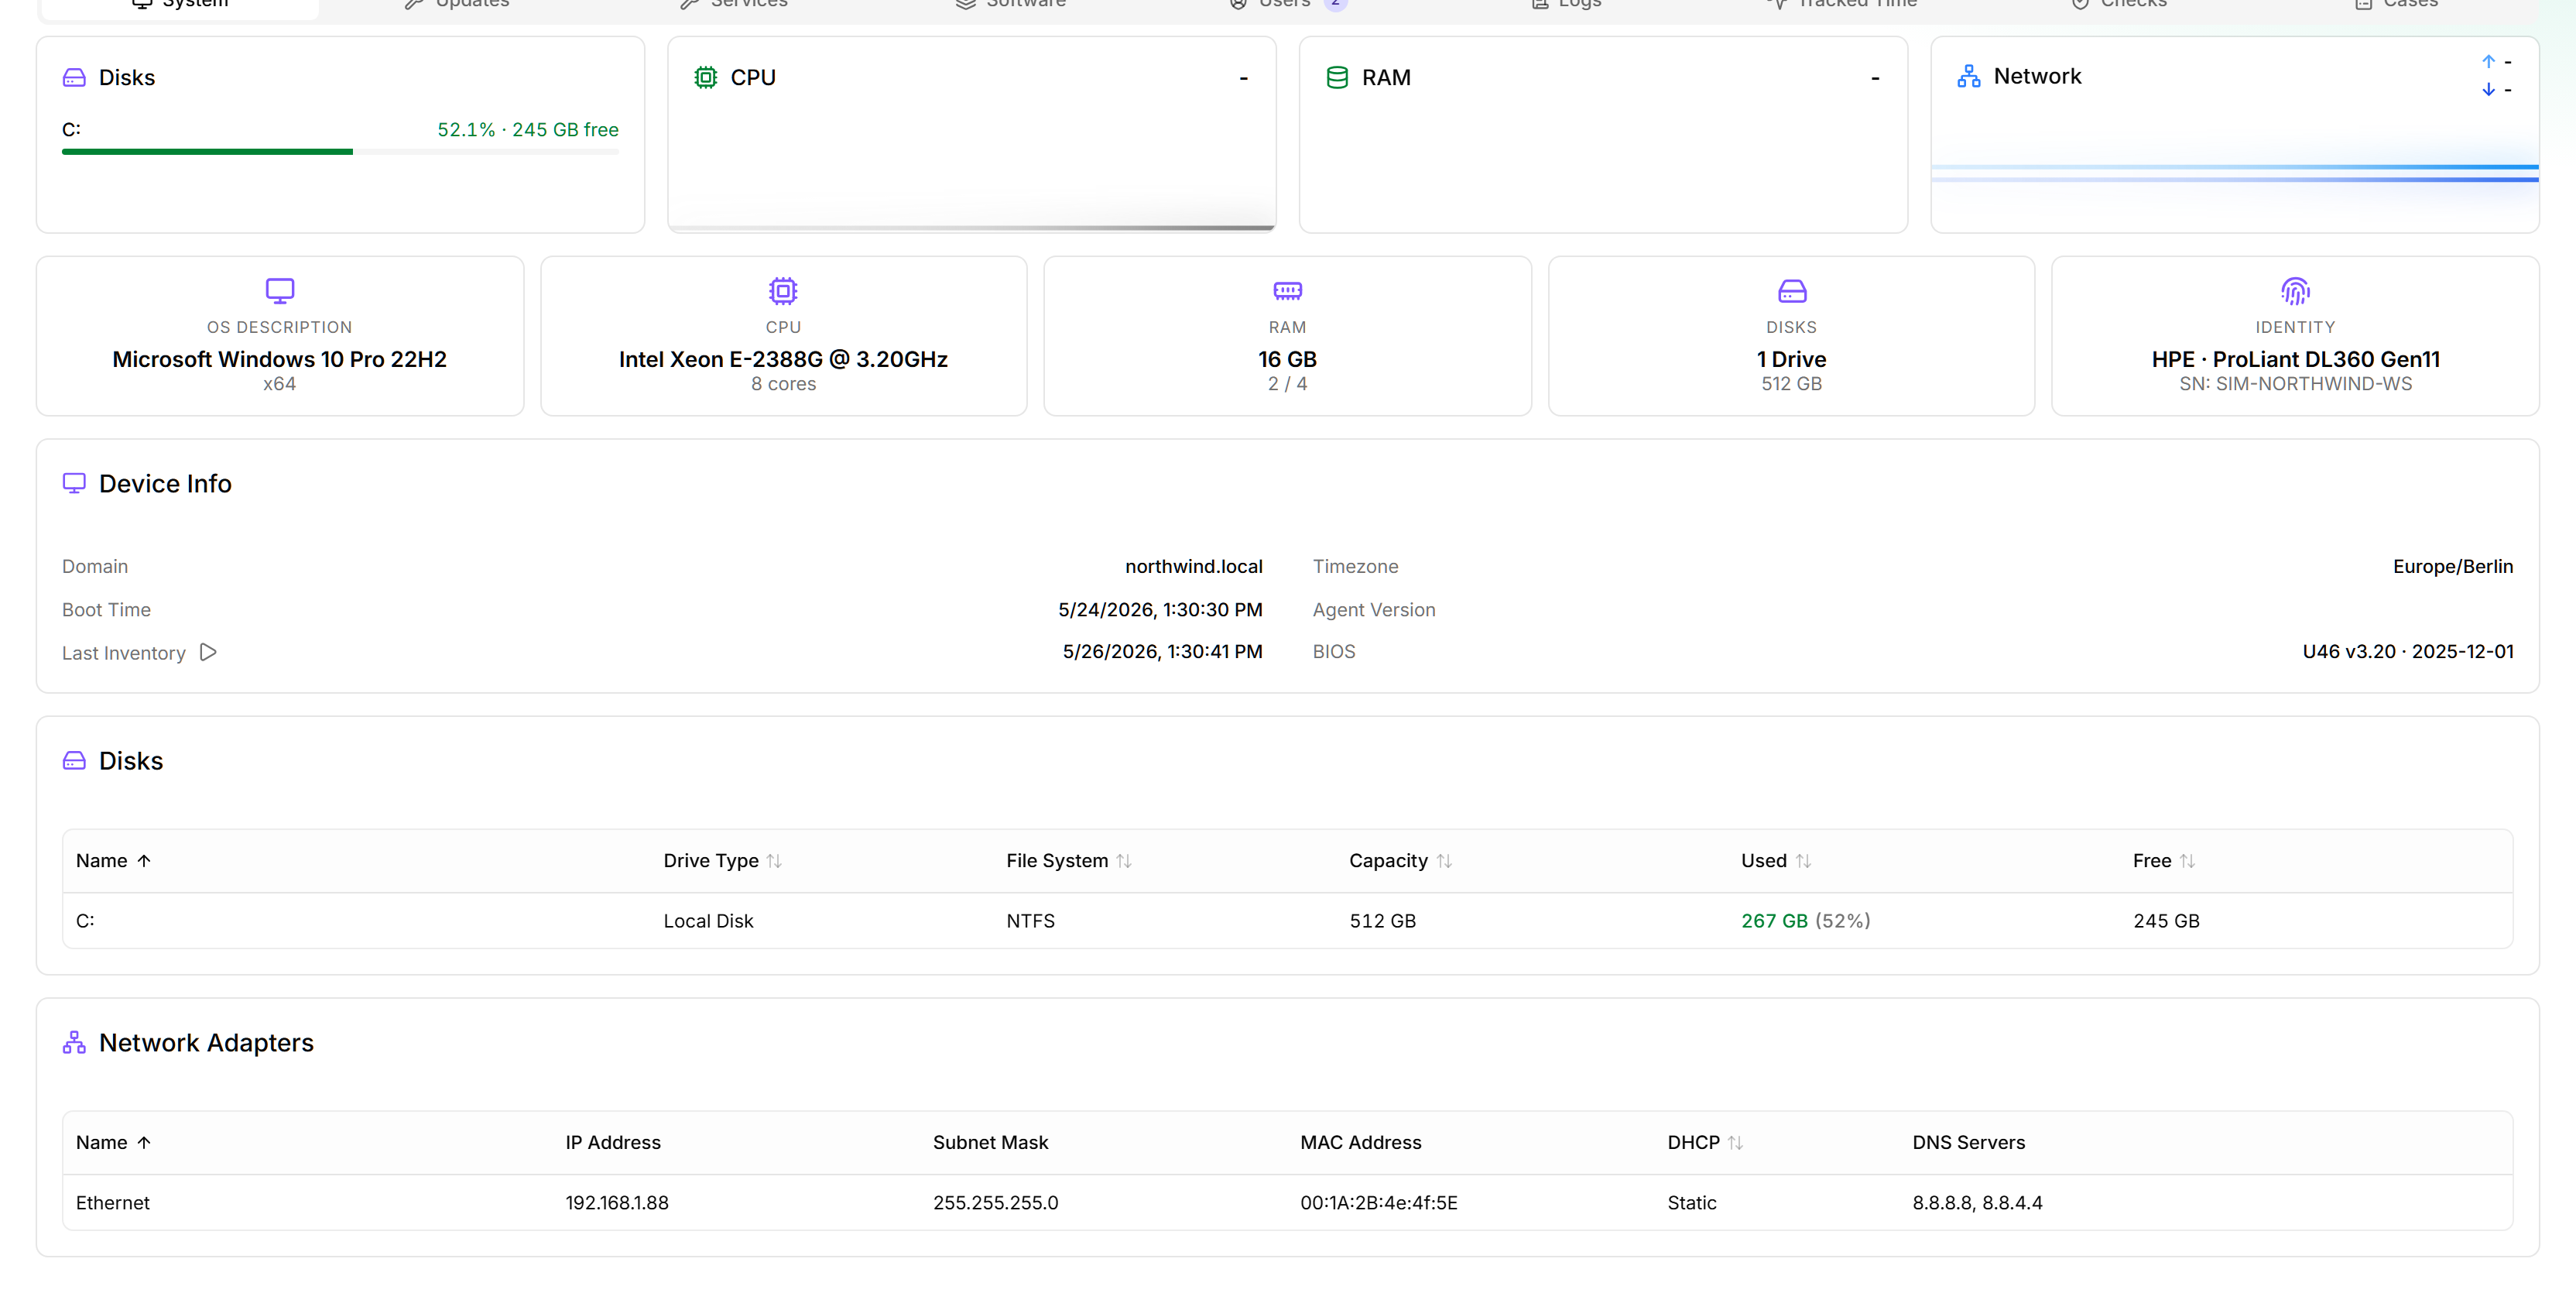
The NORTHWIND-WS-001 device detail page on the System tab, showing live CPU, RAM, disk, and network sparklines updating in real time, with hardware identity tiles below.

Manage services and processes

While viewing a device, you can take action directly from the live tabs:

ActionHow
Start a serviceOpen the Services tab, find the service, click Start service
Stop a serviceFind the service, click Stop service
Restart a serviceFind the service, click Restart service
Kill a processOpen the Processes tab, find the process, click Kill process

The actions are icon-only buttons — hover one to see its label as a tooltip. Stopping or restarting a service and killing a process ask for confirmation before executing. Service and process actions are logged in the device activity log (the Logs tab) under the source Remote Action.

Tips

  • If the live tabs show no data, the device may have just gone offline. Check the connection indicator at the top of the page.
  • Data is polled from the agent in real time. If multiple users are viewing the same device simultaneously, each view makes its own requests to the agent.
  • Live telemetry reflects the current moment only. To track performance trends over time, set up Checks — each check run records its result, giving you a growing history automatically.