Configure a CPU Load Check
Add a CPU Load check to a device and get alerted when CPU usage stays high.
Written By Stefan Steuer
Last updated 26 days ago
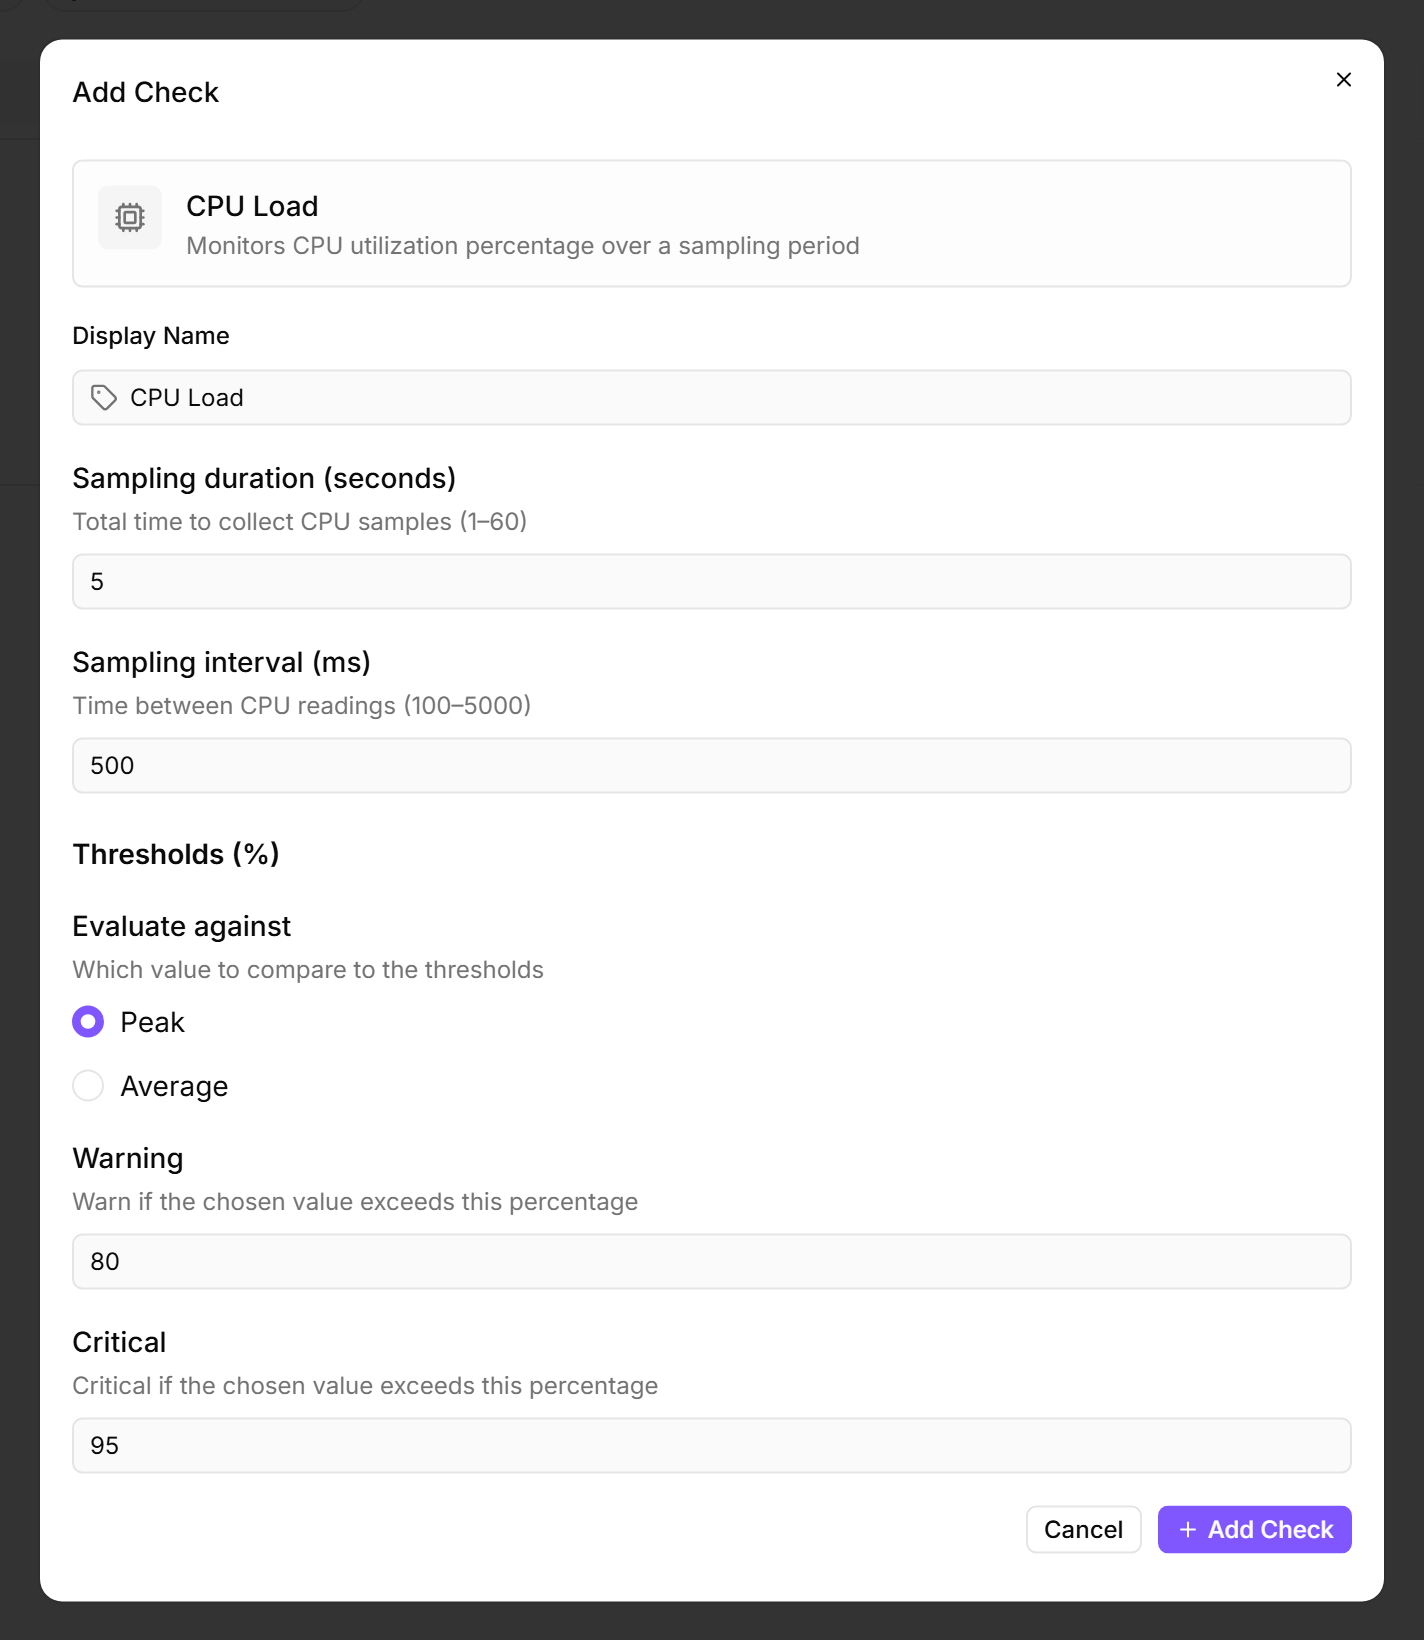
A CPU Load check samples processor usage on a device for a few seconds and raises a warning or critical alert when the result crosses your thresholds. Use it to catch runaway processes, long-running workloads, and capacity ceilings before they affect users.
Prerequisites
- You need the Monitoring Check Management permission. This permission lets you add and edit checks on devices. Your administrator assigns permissions under Administration → Groups.
- The target device must be online and have the octoja agent installed.
Steps
- Go to Devices and open the device you want to monitor.
- Click the Checks tab → Add Check → CPU Load.
- Configure the thresholds:
- Click Add Check.
What the check reports
Each run produces the average and peak CPU usage over the sampling window, along with the number of samples collected. The result severity (OK, Warning, or Critical) follows the threshold you chose under Evaluate against.
Tips
- For workstations and end-user laptops, the default thresholds (80% / 95%) are a good starting point. Tighten them if you have headroom-sensitive workloads.
- For servers running batch jobs (backup, compilation, video encoding), use Average as the evaluation metric to avoid noisy warnings during expected workload peaks.
- The agent samples CPU usage for a short window (default 5 seconds, taking one reading every 500 ms) on each run. The whole check runs every 5 minutes — frequent enough to catch sustained load but light on the device.
- If the agent cannot read CPU counters (very rare — usually a permissions issue on the device), the check returns a warning with the message "Unable to collect CPU samples". Check Product Status & Known Limitations if you hit this on a device that previously worked.
After the first check interval, the result appears in the device's Checks tab.
See also: CPU Load Check Reference