Configure a RAM Load Check
Add a RAM Load check to a device and get alerted when memory usage stays high.
Written By Stefan Steuer
Last updated 28 days ago
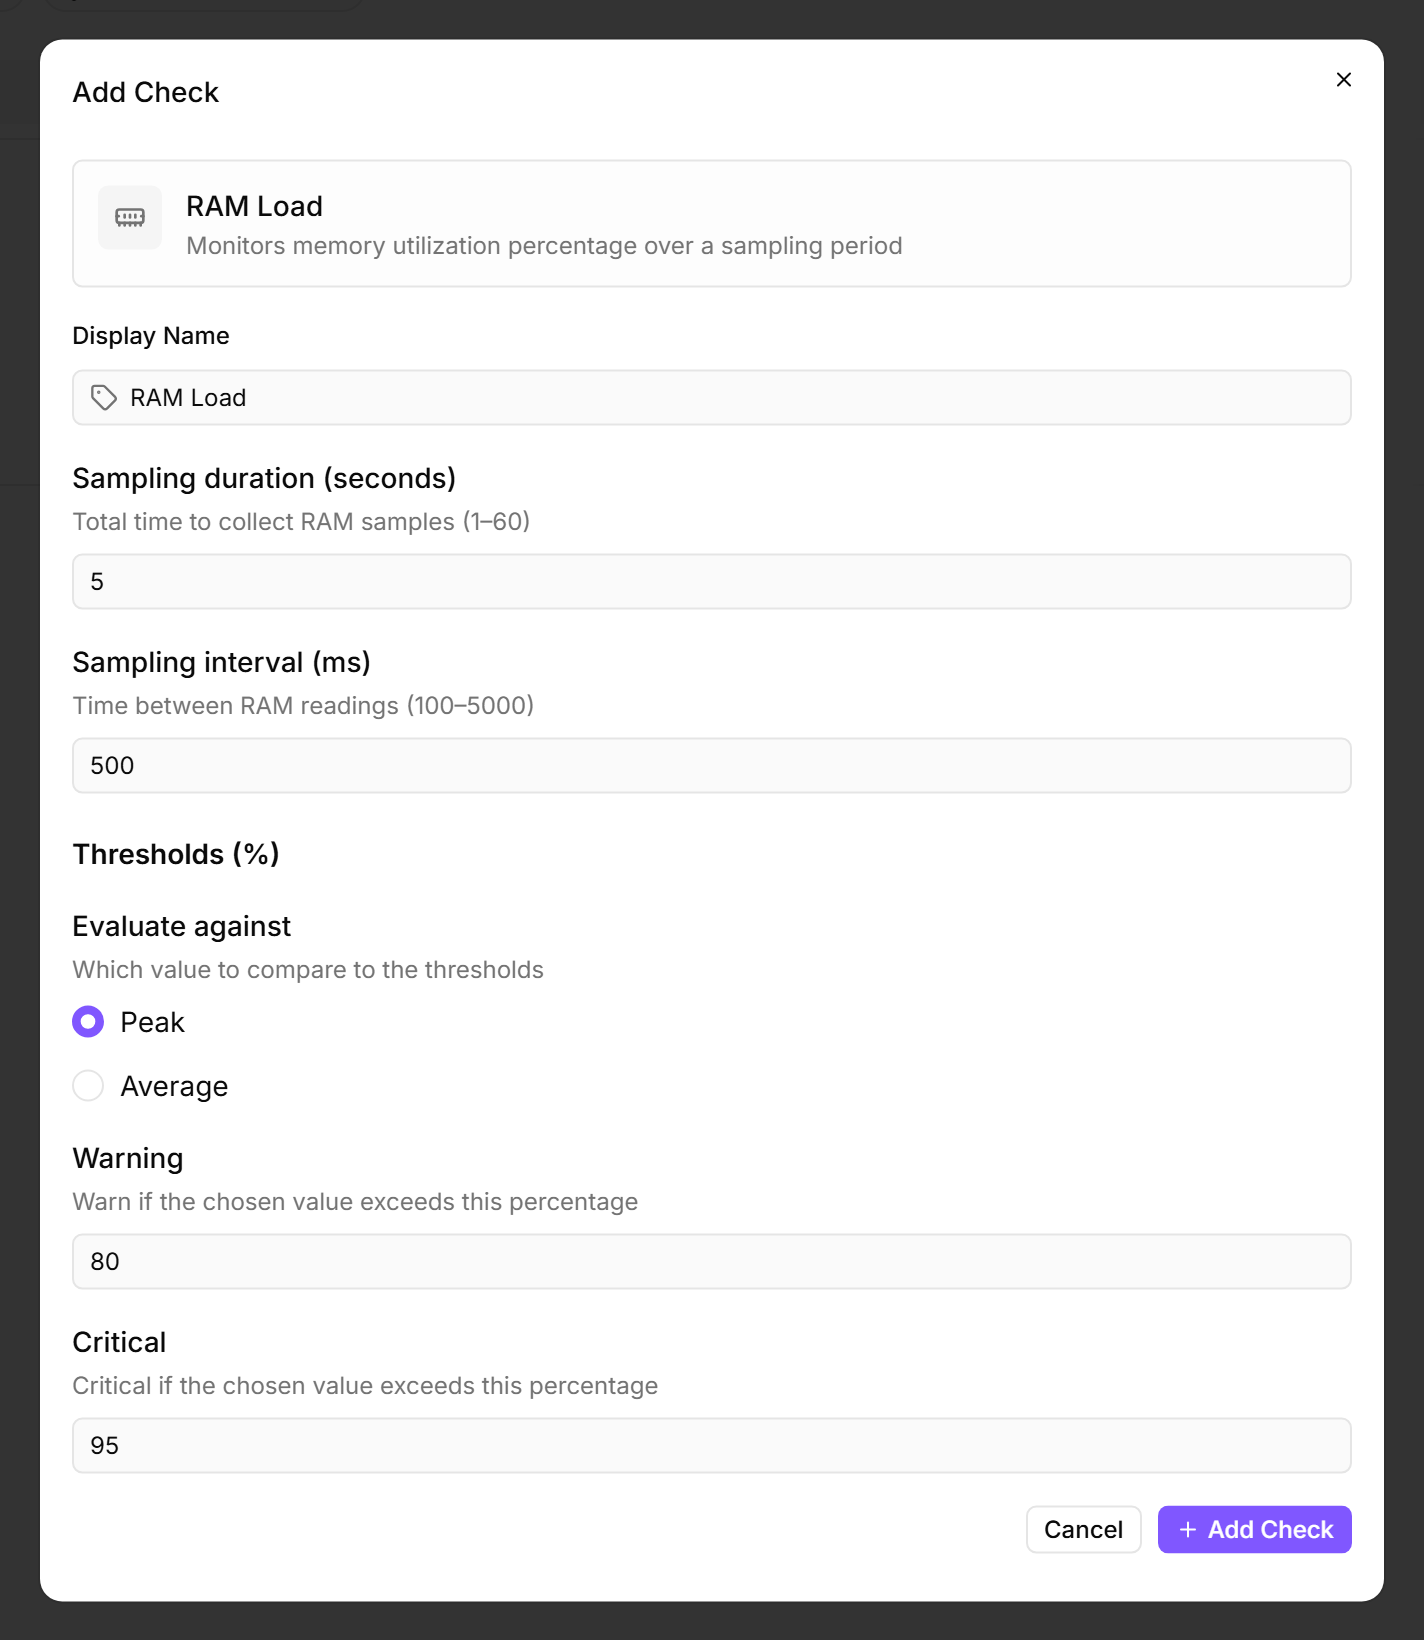
A RAM Load check samples memory usage on a device for a few seconds and raises a warning or critical alert when the result crosses your thresholds. Use it to catch memory leaks, undersized servers, and runaway processes before they start swapping or crashing applications.
Prerequisites
- You need the Monitoring Check Management permission. This permission lets you add and edit checks on devices. Customers assign permissions under Administration → Groups.
- The target device must be online and have the octoja agent installed.
Steps
- Go to Devices and open the device you want to monitor.
- Click the Checks tab → Add Check → RAM Load.
- Configure the thresholds:
- Click Add Check.
What the check reports
Each run produces the average and peak memory usage over the sampling window, the number of samples collected, and the device's total installed memory in gigabytes. The result severity (OK, Warning, or Critical) follows the threshold you chose under Evaluate against.
Tips
- For end-user workstations, the default 80% / 95% thresholds usually work. For servers that intentionally cache aggressively (database servers, file caches), raise the warning threshold or switch to Average evaluation.
- RAM-load alerts often precede CPU swap-thrashing alerts by minutes. Combining this check with a CPU Load check on the same device catches both ends of the memory-pressure spectrum.
- The check shows the device's total installed memory alongside the usage percentage, so the absolute amount is visible without leaving the check view.
- If the agent cannot read memory counters, the check returns a warning with the message "Unable to collect RAM samples". This is rare — check octoja Availability & Status if you hit it on a device that previously worked.
After the first check interval, the result appears in the device's Checks tab.
See also: RAM Load Check Reference